

The various atomic spectroscopy methods deliver information about the qualitative and quantitative composition of an analyte.
One such spectroscopic method to analyse materials and substances is optical atomic emission spectroscopy (OES or AES). The term “optical” results from the fact that this method used to be restricted to the spectral range visible to the human eye with the help of common components like lenses or mirrors. Atomic spectroscopy deals with the interaction between electromagnetic radiation and free atoms, which means atoms in their gaseous state.
Atomic spectroscopy can result in emission (light radiation), absorption (light extinguishment) or a combination of both (atomic fluorescence).
Atomic Emission
Spark spectrometers utilise the physical principles of atomic emission (spark AES), whereby the electrons of free atoms are excited to higher-energy states that permit them to put out electromagnetic radiation (light). This in turn can be used for the purpose of material characterisation.
Spectral Lines
In contrast to molecular spectroscopy, atomic spectroscopy brings forth so-called spectral lines. These lines are characterised by a narrowly defined (wavelength or frequency) bandwidth. An example of the atomic emission spectrum of Hg (visible) and Fe (UV) is shown below:

The position (wavelength) and luminance (intensity) of the emitted spectra deliver information about the type of atom and its quantity. As a result, this method can provide qualitative and quantitative results.
Atomic Model
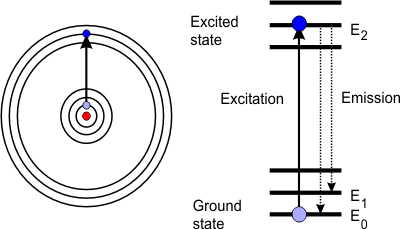 The cause of atomic spectra can be explained using Bohr’s model and the subsequently developed quantum mechanical description (orbital theory). According to this, atoms are made up of a positively charged nucleus that is surrounded by shells (orbitals) of negatively charged electrons. The further away these shells or orbitals are from the nucleus of the atom, the higher the energy level of such an electron. By adding thermal or electrical energy (e.g. flame or spark), electrons take up additional energy and thus migrate to an outer-lying orbital. The electrons then “fall” back from this outer-lying orbital a short time later (a few nanoseconds) and in doing so emit their excess energy, e.g. in the form of light. Atoms emit radiation, an effect you can observe in any fluorescent lamp. The diagram shows an electron shell, whose basic E0 state is excited to E2. From there, it can then fall back to E1 or E0. The resulting emission lines are characterised by their frequency ν or wavelength λ:
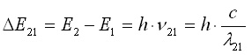
During the electronic transition from E2 to E0, the resulting shorter wavelength differs from 21. The electronic transitions of atoms are described in so-called energy level schemes. The energy differences and with that the possible wavelengths of emission lines are therefore known.
What is Light?
In the 19th century, scientists spent many years debating whether light consisted of particles of matter (photons) or wavelengths, similar to the waves in a pool of water. There are experiments that lend weight to each of these theories. However, by now it is thought that light can only be described with the help of both theories, i.e. light is both matter and electromagnetic wave (wave-particle duality) at once.
Electromagnetic Spectrum
The wavelength range in which the electromagnetic waves are detected using spectroscopic methods characterises the respective method.
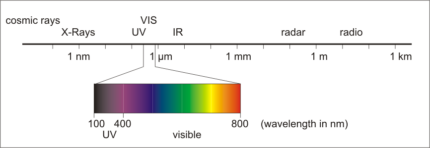 X-ray spectroscopy is characterised by very short wavelengths. In this case, electrons are freed from the atom by very high energy radiation. X-ray spectroscopy is typically used for analysing solids.
Longer wavelengths are typical of optical spectrometry methods, to begin with in the non-visible UV range (200-400 nm) and then in the smaller visible spectral range from violet (400 nm) to red (800 nm). In this case, only the electrons in the outermost orbitals of the atoms are excited.
Following on from optical spectroscopy, the infrared range, which we perceive as heat radiation, appears via the near infrared range. Molecular spectroscopy methods are used for this.
Excitation within the Plasma
Atomic emission spectroscopy can be used to analyse gases, fluids and solids. If a solid or fluid is being analysed, the substance first has to be vaporised and atomised. In this gaseous state, the atoms are then excited by a suitable electronic energy source, thus creating a plasma – a mixture of atoms, molecules and charged particles (electrons, ions).
There are various ways of creating a plasma. In the past, materials were initially analysed that were vaporised and excited with the help of flames. The method was restricted to elements that were easy to vaporise and excite. Flame-excitation is therefore suitable for about a fifth of all the elements and permits simple detection of alkali metal and earth alkaline metal salts (e.g. Na, Li, Ca, Mg). However, most other elements require higher energy levels that can, for instance, be supplied in the form of gas discharges. These can take on several forms:
- stationary discharges (arc, glow-discharge, hollow cathode lamp)
- non-stationary discharge forms (spark, corona discharge, laser)
- time-dependent current/voltage sources (inductively coupled plasma, microwaves)
read more »